Linkedin
Facebook
Youtube
Instagram
Envelope
Table of Contents
In Brief
- Q1 2023 was generally positive for global markets
- Economic data continued to be strong, albeit inflation, although falling, remained higher than desired
- Bank failures in March dented returns, which added to market uncertainty and raised, already heightened, global recession risk
- Continental European equities continued their strong run of outperformance, joined by more expensive growth equities which have seen a strong recovery YTD after a tough 2022
Quarter Overview
The new year brought better fortune to global markets. January saw falling inflation figures in most regions, in-line or more than expected, and this prompted hope that the central bank interest rate hike cycle might soon end. Lower energy costs drove the lower price rises, especially in Europe where falling demand was helped by warmer weather. Market sentiment was also boosted by activity picking-up quickly in China after they dropped their Covid restrictions towards the end of 2022. During the month, bonds delivered strong returns as future interest rate expectations fell, and equities rallied on the back of improving economic data.
The US, UK and Eurozone all raised rates at their February meetings, in-line with expectations. Strong economic data lessened recession risk in major economies but also led to market expectations of interest rate cuts being pushed out further into the future. Higher for longer interest rate expectations were bolstered by a number of central bank officials’ public statements which fed through into higher bond yields and thus lower bond prices for the month. And whilst lower risk of recession was a tailwind for equities, ultimately higher rate expectations proved more powerful and broad equity markets retraced some of their January gains.
US regional bank failures, as well as the forced takeover of Credit Suisse by UBS in Europe, dominated financial market news in March. The impact of this was felt globally and risk appetite was muted. At the same time, major developed market central banks continued to raise interest rates to further push down inflation. Whilst economic data remained robust and pointed to a strengthening global economy, the fallout from the banking sector issues reduced expectations for future rate rises which caused bond yields to fall and hence bond prices to rise. Equity market performance was mixed: fragility and a risk-off sentiment broadly resulted in cyclicals (and particularly financials) falling, but larger growth-oriented stocks bounced as bond yields (and hence the discount rate on their future earnings) fell.
Overall, the first quarter of the year saw a good performance from most asset classes, particularly continental European equities. The major exception was global commodities, which retraced some of their gains from 2022. The pound strengthened against most currencies over the quarter.
Volatility, as measured by the VIX index, fell over the quarter. Developed market equities (as measured by the MSCI World Index including dividends) rose 4.8% in sterling terms over Q1. The FTSE 100 rose 3.6% over the quarter including dividends and emerging market equities (MSCI EM Index) rose 1.1%. Global bond yields fell over the quarter leading to higher quality bonds (as measured by the Bloomberg Global Aggregate Index) rising 2.6% (bond yields and prices move in opposite directions). Lower quality ‘high yield’ bonds rose alongside stronger risky assets in general, up 2.6%. After strong gains last year, oil fell 7.1% over the first quarter but gold rose 8.0%, benefitting from robust central bank demand but also concerns about banking failures towards the end of the quarter.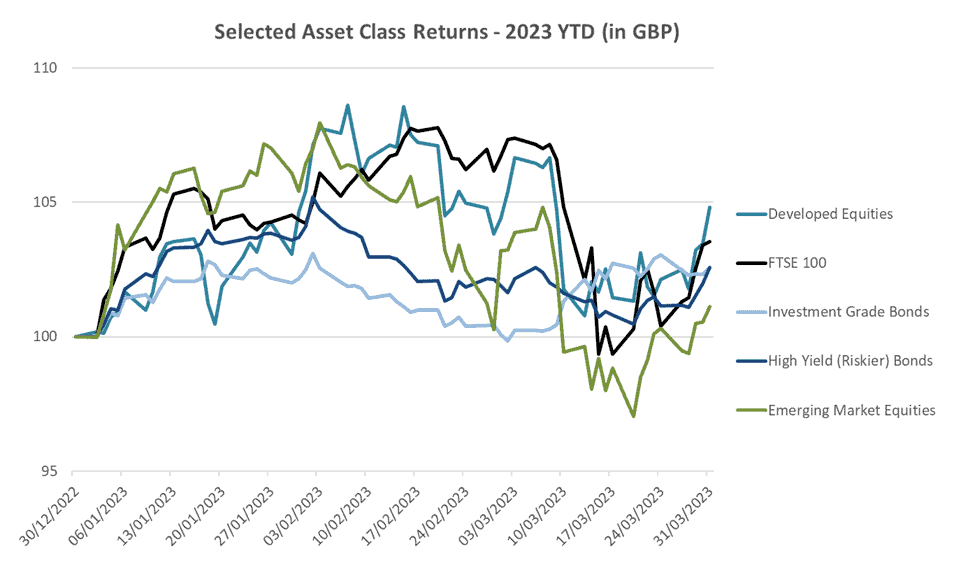
Data source: Financial Express
Indices used (including interest & dividends): Investment Grade Bonds – GBP hedged Bloomberg Global Aggregate Index; High Yield (Riskier) Bonds – GBP hedged Bloomberg Global High Yield Index, Developed Equities – MSCI World Index in GBP; Emerging Market Equities – MSCI Emerging Markets Index in GBP; FTSE 100 (UK Large Capitalisation Equities)
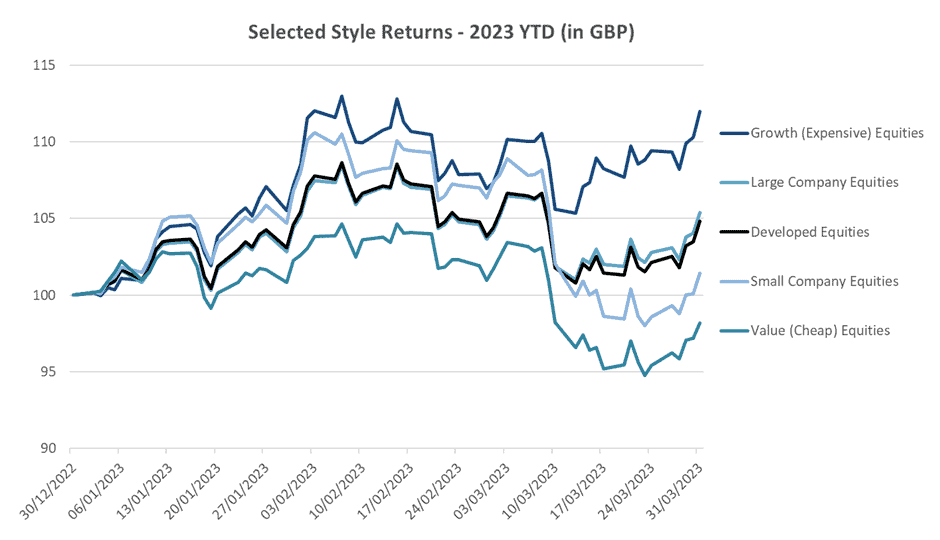
Diving into stylistic performance within indices, high-price equities (often described as ‘growth’) rose strongly over the quarter, up 12%, global larger companies rose marginally more than developed equities (up 5.4%), whilst global smaller companies were up only 1.5%. Cheaper ‘value’ companies (which generally includes oil & gas and other commodity companies as well as banks) underperformed over the quarter, down 1.8%.
Data source: Financial Express
Indices used (including interest & dividends): Developed Equities – MSCI World Index in GBP; Growth (Expensive) Equities – MSCI The World Growth Index; Value (Cheap) Equities – MSCI World Value Index; Small Company Equities – MSCI World Small Cap Index; Large Company Equities – MSCI World Large Cap Index
In terms of currencies, the pound had a strong quarter. It rose 2.1% against the US dollar, 0.7% against the euro and 3.4% against the yen.
Portfolio Performance Overview
The PortfolioMetrix Core portfolios rose over the quarter. Asset allocation was a slight headwind due to overweights to lagging UK and Japanese equities, as well as small allocations to listed property and infrastructure which also underperformed. Active fund performance also proved a minor headwind over the quarter.
Sustainable World portfolios were broadly in-line with Core portfolios. Lower- and mid-risk Sustainable World portfolios slightly underperformed their Core equivalents but higher-risk Sustainable World portfolios slightly outperformed.
Looking Forward
The themes driving 2023 have so far been similar to those driving 2022. Last year was all about higher than expected inflation, and hence higher than expected interest rates as central banks acted aggressively to contain inflation. Also, there was always the underlying question of whether these interest rate rises were too aggressive, and would tip the world economy into recession.
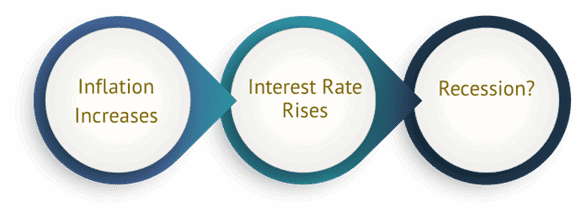
2023 has generally seen falling inflation, but so far it hasn’t been sufficient for central banks to have ended raising rates, although it does look like we are now close. Inflation and interest rates thus remain the key drivers of markets, but the bank failures of March have brought into starker relief the possibility of more dramatic than expected economic slowdowns.
Firstly, the good news. We are unlikely to see a repeat of the 2008/2009 global banking crisis. In general, this is because global economic shocks are, almost by definition, caused by unexpected events and not exact re-occurrences of the events that led to previous crises. More specifically though, the banks that failed in March 2023 were, in important respects, outliers: badly managed and less regulated regional banks in the US and the perennially crisis prone Credit Suisse in Europe. The banking system as a whole, however, is now far more tightly regulated and much healthier. Most importantly, it currently holds much greater surplus assets to make up for any loan losses than it did in 2008 (in banking regulation parlance it is much ‘better capitalised’, having higher capital to asset ratios):
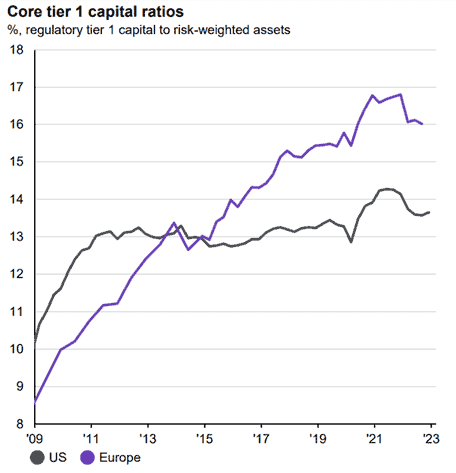
Source: J.P. Morgan Asset Management Guide to the Markets Q2 2023
The bad news is that after March, banks are likely to pull back on their lending. In particular, regional banks in the US, which are key lenders to smaller and mid-sized businesses, benefitted from lower regulation up until now. Going forward they will see a lot more regulation and, given investor and depositor nervousness, will almost certainly tighten up on extending credit. This is likely to be a headwind to growth for the broader economy.
More generally, the failures are a specific example of the usual effect of higher interest rates. Higher interest rates cause stress within the economy. Money (the ability to borrow), which previously had been cheap, suddenly costs more. And this additional monetary stress inevitably uncovers previously hidden weaknesses in economies. We saw it in the UK with the Liability Driven Investment (LDI) gilt sell-off late last year and we’ve just seen it again with the failure of Silicon Valley Bank and the UBS takeover of Credit Suisse. The exact form of the weakness is often surprising, but there are similar incidents every time central banks raise rates. Very occasionally, the weaknesses uncovered are systemic and serious (like the housing issues during the global financial crisis), but more normally they are relatively minor and self-contained, like an increase in the number of company bankruptcies. Bankruptcies themselves are a normal part of capitalism as economies adapt and improve (so called ‘creative destruction’) and markets can still do well, overall, in these environments.
What are the reasons for optimism this time? Firstly, most assets are significantly more attractively priced now than they were prior the beginning of last year (the biggest falls in markets tend to be when they are most expensive). Moreover, it is certainly possible to find investments that are cheap relative to history and thus offer good long-term value for investors. And, unsurprisingly, these are the assets that make up the bulk of our portfolios.
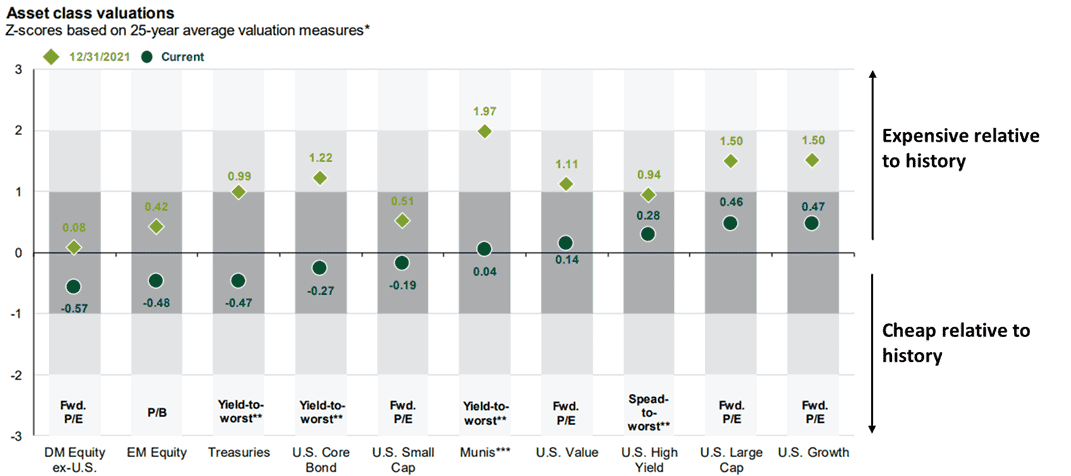
Source: J.P. Morgan Asset Management Guide to the Markets US, 5 April; a Z-Score of 0 is average relative to history, roughly 68% of historical observations have Z-Scores between -1 and 1 and roughly 95% of historical observations have Z-Scores between -2 and 2
Secondly, it does appear that inflation is now falling and thus we are very close to the end of the current rate hiking cycle. This doesn’t automatically imply that inflation will fall as fast as we all hope or that interest rates will fall over the short-term, but even a cessation of rate rises would remove a material headwind to investment performance from now on.
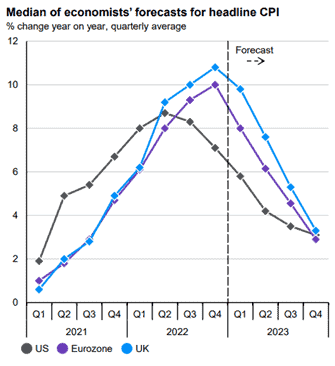
Source: J.P. Morgan Asset Management Guide to the Markets UK Q2 2023
Risks remain, of course, they always do. Not only do we have higher interest rates than we’ve had for 15 years (and hence the potential for more surprises from any companies or economies unable to cope with higher rates), but we also have political risk (the US debt ceiling stand-off between Democrats and Republicans comes to mind). We also still have a war going on in Europe.
So, how do we handle investing in this environment? We believe, given the long-term rewards implicit in current valuations, the correct response is not to rush to cash every time we hit an inevitable bump in the road. This can lead to missing out on recoveries. Rather the correct response is to continue to choose investments that are attractive based on their fundamentals, and to make sure that their portfolio remains very well diversified to handle any future “inevitable surprises”.
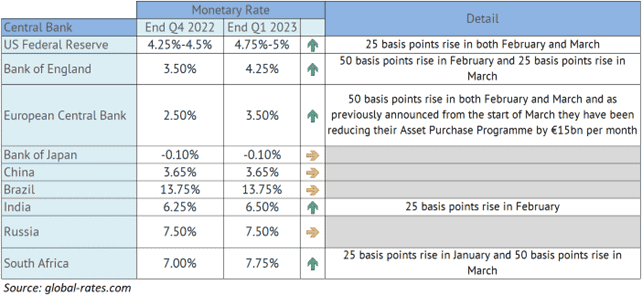
Data: Monetary Policy* (Rates & Extraordinary Measures)
The first quarter of 2023 saw continued tightening by western central banks, with the US Federal Reserve, Bank of England and European Central bank all raising rates. Markets are now pricing in only limited further tightening. A number of other countries globally also raised rates, although the impetus was notably weaker in emerging markets with China, Brazil and Russia all holding steady. All eyes remain on the last major central bank still to have negative rates, the Bank of Japan, whose new governor, Kazuo Ueda, took over on 8 April with the tricky task of normalising Japan’s monetary policy.
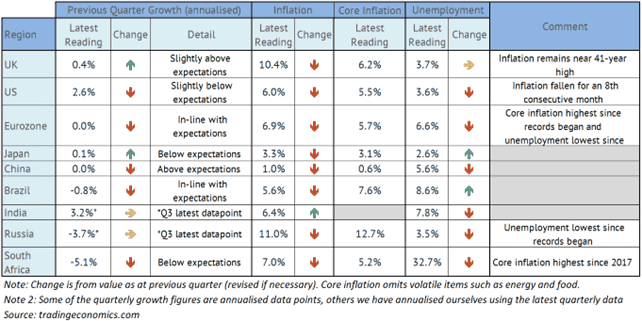
Data: Global Economies
GDP figures released in the first quarter were for Q4 2022 and were mixed. The UK’s performance was weak, but was positive and ahead of expectations, whilst the US’s GDP was stronger, but behind expectations. Inflation continued to fall across most jurisdictions, albeit this is primarily due to falling energy prices and not ‘core inflation’. Unemployment generally remained low; a positive given the recession worries globally.
Data: Asset Classes
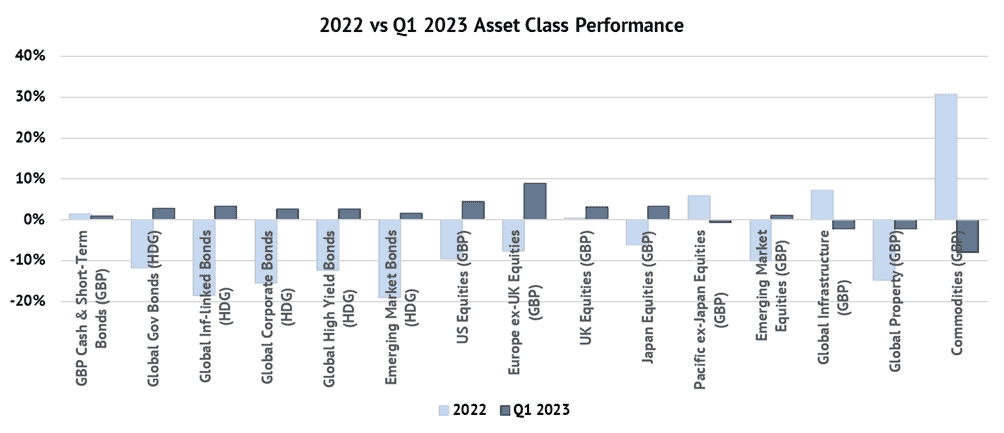
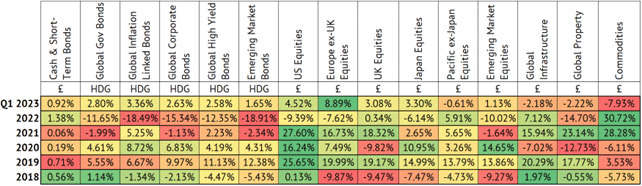
Data source: Financial Express
Indices used: Bank of England SONIA, GBP hedged version of Bloomberg Global Treasury Index, GBP hedged version of Bloomberg Global Inflation-Linked Index, GBP hedged Bloomberg Global High Yield Index, GBP hedged version of BoA US Emerging Markets External Sovereign Index, MSCI North American Index, MSCI Europe ex-UK Index, FTSE All Share Index, MSCI Japan Index, MSCI Pacific ex-Japan Index, MSCI EM Index, FTSE Global Core Infrastructure 50/50 Index, FTSE EPRA NAREIT Global Index and Bloomberg Commodity Index
Note: The above returns are total returns, including dividends and interest payments. Asset classes with the “HDG” label are currency hedged to pounds sterling, which means that foreign currency movements are removed whilst those with the “£” label indicate that we are reporting returns to British holders which includes the effects of the foreign currency moves non-UK listed securities are exposed to.
Data: Indices, commodities, Currencies
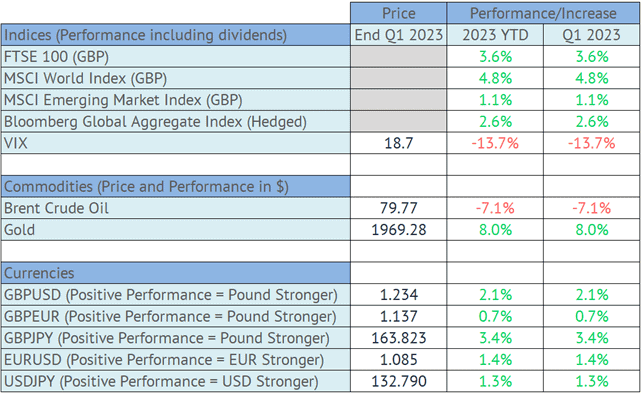
Key
- FTSE 100 is an index of the 100 largest companies by market capitalisation listed on the London Stock Exchange. Crucially, whilst these companies are priced in sterling, the majority of their revenues comes from outside the UK making the FTSE 100 more a global, rather than domestic UK, index.
- MSCI World Index is used to gauge global developed market equity performance. This is heavily influenced by US equity performance which, as the world’s biggest equity market, makes up more than half of the index. Not to be confused with the MSCI All Country World Index, which includes both developed equities and emerging market equities.
- MSCI Emerging Market Index measures emerging market equity performance.
- Bloomberg Global Aggregate Index represents global investment grade bond markets, mostly made up of government bonds.
- Chicago Board Options Exchange Volatility Index (VIX) is a measure of implied volatility in the S&P 500 Index (how volatile market participants expect big US equities to be/how risky they view them to be). It is also known as the “fear index” – with higher numbers crudely representing “more fear” in markets and lower numbers crudely representing “more greed”.
- Brent Crude oil prices are a key indicator of movements in the global oil market, the world’s most important commodity as it is such an important input into economic activity (in providing energy and as a raw material in production of materials such as plastics).
Data Source: PortfolioMetrix, Bloomberg
*Glossary of Financial Terms
- Hedging back to sterling: The risk of currency fluctuations can be removed by “hedging” the foreign currency back to the pound. In this way, a UK investor holding a US government bond or bond fund would not experience changes to the pound to US dollar exchange rate and their holding would be a lot less volatile/risky.
- High yield: High yield debt is rated below investment grade and is riskier. It has a higher yield to compensate for this additional risk.
- Monetary Policy: The decisions central banks make to influence the supply of money in an economy, primarily the setting of base rates in the economy, but also through certain extraordinary measures such as quantitative easing.
- Quantitative easing: Quantitative easing refers to expansionary efforts by central banks to help increase the supply of money in the economy (and help indirectly lift the economy). It involves the central bank purchasing financial assets, mainly government bonds.
- Quantitative tightening: A mechanism for decreasing the supply of money in the economy to cool excess growth (above a stable level). It involves the central bank allowing purchased bonds to mature or in more extreme cases selling previously purchased financial assets.
- Quarterly vs annualised growth rates: Some national statistical agencies prefer to quote country growth levels in a quarter as an actual quarterly rate (the estimate of growth over three months, x, sometimes referred to as “on quarter” growth) whilst others prefer to quote the growth over the quarter on an annualised basis (i.e. assume the growth over three months continued for a year, approximately 4x). Unless specified otherwise we quote only annualised rates using actual calculations rather than the simplified approximation of annual rate = 4 x quarterly rate.
This document is only for professional financial planners advisers, their clients, and their prospective clients. The information given here is for information purposes only and is not intended to constitute financial, legal, tax, investment, or other professional advice. It should not be relied upon as such and PortfolioMetrix cannot accept any liability for loss for doing so. Any forecasts, expected future returns or expected future volatilities are not guaranteed and should not be relied upon. The value of investments, and the income from them, can go down as well as up, and you may not recover the amount of your original investment. Past performance is not a reliable indicator of future performance. Portfolio holdings and asset allocation can change at any time without notice. PortfolioMetrix Asset Management Ltd is authorised and regulated by the Financial Conduct Authority. Full calculation methodology available on request.
Related Articles
Why not sign up for our monthly newsletter
Each month we send out our newsletter and our latest publication. We cover all aspects of financial planning. It’s free and you can unsubscribe any time.
Important Info
This article is not intended to be financial advice. It is important to consult a professional when considering Investing. The value of investments can change, and it is possible to lose money.
Customer Reviews
[trustindex data-widget-id=83113cd14e3f32327f768d7c0f9]