Q4 2020 Quarter End Review
- Q4 2020 saw extremely sharp gains across risk assets, particularly those hardest hit earlier in the year.
- Proof that a number of vaccines worked fuelled the rallies, but Joe Biden’s US presidential win and the avoidance of a no-deal Brexit also drove gains.
- The second wave of COVID-19 resulted in further lockdowns as immense vaccination programmes got underway.
- The key risks for 2021 are any complications around the vaccine roll-out or the collapse of what appears to be speculative excess in parts of the market.
Quarter Overview
October was a challenging month for markets. The increases in COVID-19 cases in Europe and the US weighed heavily on their equity markets towards the end of the month, with falls accelerated by announcements of new lockdown restrictions in countries across Europe. Political uncertainty was also at the forefront of investors’ minds, with October being the last month of political lobbying ahead of the US election on 3 November and further Brexit negotiation posturing by both the UK and EU.
November was a stellar month for markets as three different vaccine trials reported successful phase III COVID-19 results on three consecutive Mondays. This provided a much-needed boost to equities, particularly more cyclical companies and those hardest hit by the impact of Coronavirus. The result of this was a significant rotation towards cheaper ‘value’ stocks and away from more expensive ‘growth’ stocks. Markets had already been edging up after it became clear Joe Biden had won the US presidential election, although President Trump disputed the outcome and unsuccessfully tried to overturn the results in the courts claiming voter fraud. Brexit remained a risk for UK investors, with no tangible progress made during the month on a deal.
December was another strong month for markets with the first western vaccine approval and vaccination taking place in the UK, with other countries following during the rest of the month. Market optimism sat at odds with further increases in both Coronavirus cases and deaths across the globe as well as the reintroduction of further restrictions on social mixing throughout Europe. The US finally approved another pandemic relief plan, and a Brexit deal was finally passed on Christmas Eve (the 1,250-page agreement document providing some light festive reading!).
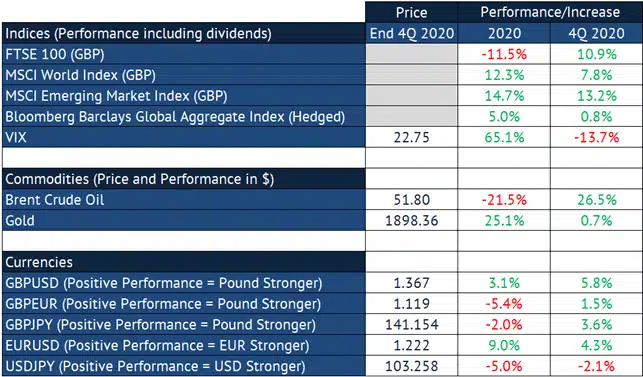
The fourth quarter as a whole was extremely strong for risk assets as vaccines provided a light at the end of the tunnel for COVID-19-hit economies. Market volatility (as measured by the VIX index) receded, and globally developed equities (as measured by the MSCI World Index) rose by almost 8% in sterling terms. The FTSE 100 rose a remarkable 10.9%, including dividends (although it still lagged behind other asset classes for the full year), and emerging market equities were up 13.2%. Commodities also rallied, with oil up a remarkable 26.5%, although gold was up only a modest 0.7%. Defensive bonds (as measured by the Bloomberg Barclays Global Aggregate, which consists mostly of government bonds) rose 0.8% over Q4, whilst riskier high-yield bonds were up 6.6%.
.

Data source: Financial Express
Indices used (including interest & dividends): Defensive Investment Grade Bonds - GBP hedged Bloomberg Barclays Global High Yield Index; Riskier Bonds (High Yield) - GBP hedged Bloomberg Barclays Global High Yield Index, Developed World Equities - MSCI World Index in GBP; Emerging Market Equities - MSCI Emerging Markets Index in GBP; FTSE 100 (UK Large Capitalisation Equities)
Diving into performance within indices, the securities of smaller companies outperformed, up over 17% for the quarter. Cheaper securities (value companies) also rose strongly, up 9.5%, while high-priced securities (often described as growth/momentum and quality companies) rose slightly more modestly, albeit still strongly, at +6.4%.

Data source: Financial Express
Indices used (including interest & dividends): Developed World Equities - MSCI World Index in GBP; Growth Equities – MSCI The World Growth Index; Value Equities – MSCI World Value Index; Small Company Equities – MSCI World Small Cap Index
The pound was up 1.5% against the euro in Q4, rose 4.2% against the US dollar and was up 3.6% against the yen. Over the year as a whole, the pound fell 5.4% against the euro, was up 3.1% against the dollar and fell 2% against the yen.
Looking Forward
2020 was quite a year, capped off by an extremely positive fourth quarter as the three main risks visible to markets receded. Positive vaccine trial data and the start of the roll-out of the injections promised an eventual end to the COVID-19 pandemic. The US elected Joe Biden, and despite Donald Trump’s best efforts, a political meltdown over an inconclusive result was avoided. And a Brexit UK-EU trade deal was finally concluded.
Brexit and US politics have thus receded as sources of acute market risk (although they are by no means completely settled). Coronavirus is, unfortunately, still very much with us and is still the most obvious source of portfolio risk as we head further into 2021. The other main source of risk at present is extreme optimism, which is shown in certain parts of the market, an optimism that might well reverse for other reasons.
Looking first at the pandemic, we are in the midst of a very serious second coronavirus wave. This has been exacerbated in the Northern Hemisphere by winter but also by the emergence of more virulent mutations of the virus, notably those in the UK and South Africa and has necessitated further partial and full lockdowns. At present, vaccines still appear to be effective against all known variants of the virus, but any problems with the vaccine roll-out or further mutations that increase resistance to the current crop of vaccines would likely delay the re-opening of economies and be very serious for both public health and for markets.
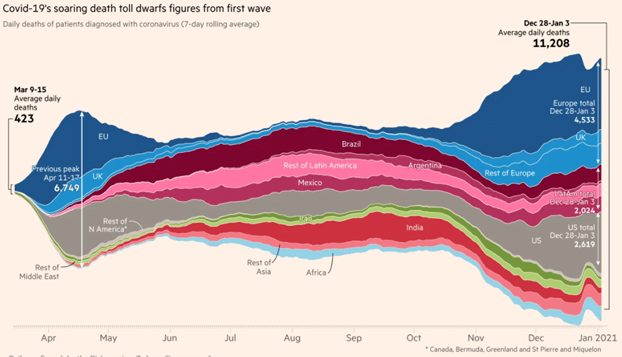
Source Financial Times, 11 January 2021
That said, markets are either at or close to all-time highs, so they are clearly betting on the success of the vaccines. And provided there are no serious hiccups, there are indeed many reasons for optimism. The new Biden presidency, the Democrats continued control of the House of Representatives, coupled with their recent victories in Georgia, which give them narrow control of the Senate, meaning that the Democrats should be able to push through significant fiscal stimulus in the form of direct transfers to US citizens as well as key infrastructure spending. This should help fuel a US recovery and, with luck, help temper the populist anger simmering throughout the country.
Elsewhere in the world, central banks have kept interest rates at rock-bottom levels whilst continuing to buy huge amounts of government debt, meaning governments can continue to borrow cheaply to prop up their economies and invest for the future. It is true that government debt has increased markedly (see below), but that matters less for countries than the total cost of servicing their debt. This continues to fall because bond yields have fallen so much in response to the virus and central bank action. Put another way: the total amount of government debt may be going up, but the rates paid on issued debt have fallen much more, resulting in the total interest paid by governments in $, £ or € actually decreasing as older bonds paying a high coupon mature to be replaced by new bonds paying very low coupons.
Government Debt may have increased…

but the cost of servicing that debt is increasing….

In addition, whilst the UK/EU Brexit trade deal is already experience teething issues as new trade frictions have emerged between the two trading partners, the removal of the possibility of a no-deal scenario should lower uncertainty in the UK and help support the value of UK assets and increase inward investment.
The UK is, as a result of being out of favour for a long time largely because of Brexit uncertainty, one of the cheapest markets at present, both in an absolute sense but also relative to other markets and its own history. Japan and Emerging Markets also look for reasonable value.
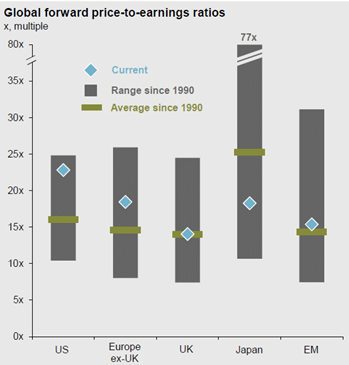
Source: J. P. Morgan Asset Management Guide to the Markets Q1 2021
Other markets are more expensive, with US equities arguably being the most richly valued. The chart below looks at Warren Buffett’s preferred measure of stock market valuation, the S&P 500’s market capitalisation against the value of the US GDP, which is at record highs. The S&P 500, despite consisting of companies listed in the US, receives a great deal of its revenue from outside the US, so arguably, it makes more sense to compare the index against global GDP – but even here, US equities are at levels not seen since the tech boom of 1999/2000.

There are, however, many different valuation metrics, and US equities aren’t expensive in all of them. Those metrics that compare US equities against US bonds (bonds being an investment ‘substitute’ for equities) show US equities as being reasonably valued. At the beginning of 2000, US 10-year bonds yielded 6.6%, whilst they started off 2021 yielding 0.9%, having become much more expensive in the interim (the price and yield of a bond moving inversely to each other). Against more expensive bonds, US equities look much more attractive – unless, of course, bond yields were to increase from here.
So, one clear risk to the equity markets is a big increase in bond yields. It’s very unlikely that central banks will increase their benchmark rates this year (the US Federal Reserve has guided towards no rate rises until 2023), but if today’s very low rates of inflation started to pick up, then it is possible that we could get rate increases sooner than expected – the anticipation of which could cause some market disruption.

DATA: MONETARY POLICY* (RATES & EXTRAORDINARY MEASURES)
There was almost no change to central bank action over the quarter as rates were kept low and central bankers maintained further quantitative easing. The board of the US Fed has signalled it does not expect to raise rates before 2023.

DATA: GLOBAL ECONOMIES
GDP figures released in the fourth quarter were for Q3, the quarter directly after the sharp falls of Q2 and showed a sharp rebound as economies began to reopen after the first lockdown. Unfortunately, expectations are for much lower figures for Q4 as second waves of the virus inhibited growth again. The latest inflation figures were mixed, with developed countries generally experiencing low inflation while emerging economies saw an inflation increase. Unemployment was mixed as some countries saw rises in employment as their economies reopened, whilst others saw job cuts as job support packages implemented during the initial lockdown were unwound.

DATA: ASSET CLASSES
In an extremely strong quarter for performance overall, developed Pacific ex-Japan equities were the strongest performer, up 13.6%, followed closely by EM equities and UK equities. US equities were the strongest-performing asset class over the year. Global listed Infrastructure was the worst-performing asset class over the quarter, up only 2.8%, but it was commodities that suffered the most over the year, dragged down by oil.
Riskier bonds continued to perform well in Q4, with global high-yield bonds leading the pack. Inflation-linked bonds were, however, the best-performing fixed-income asset class over the year. Click here to view the Investment Commentary from Q4 in 2017.


Note: The above returns are total returns, including dividends and interest payments. Asset classes with the “HDG” label are currency hedged to pounds sterling, which means that foreign currency movements are removed whilst those with the “£” label indicate that we are reporting returns to British holders which includes the effects of the foreign currency moves non-UK listed securities are exposed to.
Data source: Financial Express
Indices used: 3m GBP LIBOR, GBP hedged version of FTSE World Government Bond Index, GBP hedged version of FTSE WorldBIG Corporate Index, GBP hedged Bloomberg Barclays Global High Yield Index, GBP hedged version of FTSE Global Emerging Markets US Dollar Government Bond Index, MSCI North American Index, MSCI Europe ex-UK Index, FTSE All Share Index, MSCI Japan Index, MSCI Pacific ex-Japan Index, MSCI EM Index, FTSE Global Core Infrastructure 50/50 Index, FTSE EPRA NAREIT Global Index and S&P Goldman Sachs Commodity Index
DATA: INDICES, COMMODITIES, CURRENCIES
Key
- FTSE 100 is an index of the 100 largest companies by market capitalisation listed on the London Stock Exchange. Crucially, whilst these companies are priced in sterling, the majority of their revenues comes from outside the UK making the FTSE 100 a more global, rather than domestic UK, index.
- The MSCI World Index gauges global developed market equity performance. This is heavily influenced by US equity performance, which, as the world’s biggest equity market, makes up more than half of the index. It is not to be confused with the MSCI All Country World Index, which includes both developed and emerging market equities.
- MSCI Emerging Market Index measures emerging market equity performance.
- Bloomberg Barclays Global Aggregate Index represents global investment-grade bond markets, mostly made up of government bonds.
- Chicago Board Options Exchange Volatility Index (VIX) measures implied volatility in the S&P 500 Index (how volatile market participants expect big US equities to be/how risky they view them to be). It is also known as the “fear index,” with higher numbers crudely representing “more fear” in markets and lower numbers crudely representing “more greed.”
- Brent Crude Oil prices are a key indicator of movements in the global oil market, the world’s most important commodity as it is such an important input into economic activity (in providing energy and as a raw material in production of materials such as plastics).
Data Source: PortfolioMetrix, Bloomberg
*Glossary of Financial Terms
- Hedging back to sterling: Currency fluctuations can be eliminated by “hedging” the foreign currency back to the pound. In this way, a UK investor holding a US government bond or bond fund would not experience changes to the pound-to-US dollar exchange rate, and their holding would be much less volatile/risky.
- High yield: High-yield debt is rated below investment grade and is riskier. Its higher yield compensates for this additional risk.
- Monetary Policy: The decisions central banks make to influence the money supply in an economy, primarily the setting of base rates, but also through certain extraordinary measures such as quantitative easing.
- Quantitative easing: Quantitative easing refers to expansionary efforts by central banks to help increase the money supply in the economy (and help indirectly lift the economy). It involves the central bank purchasing financial assets, mainly government bonds.
- Quantitative tightening: A mechanism for decreasing the money supply in the economy to cool excess growth (above a stable level). It involves the central bank allowing purchased bonds to mature or, in more extreme cases, selling previously purchased financial assets.
Quarterly vs annualised growth rates: Some national statistical agencies prefer to quote country growth levels in a quarter as an actual quarterly rate (the estimate of growth over three months, x, sometimes referred to as “on-quarter” growth), whilst others prefer to quote the growth over the quarter on an annualised basis (i.e. assume the growth over three months continued for a year, 4x). We tried to quote only an annualised rate above using the following approximate relationship: annualised rate = 4 x quarterly rate.